Creating raster elevations from X Y Z data sets
::: shaded The files required to follow this tutorial can be extracted from the 'ExampleProjects' zip file under the 'InterpolatingRasterTutorial' folder. This zip file is downloaded separately from your installation materials. :::
RiverFlow2D uses elevation data in raster format. For instance, to load an ASCII grid file, from the Layer menu, click Add Layer, and then click Add Raster Layer... You may also click the Add Raster Layer button:

In this example we will use elevation data available in a tab delimited X Y Z file, and create an interpolated raster layer.
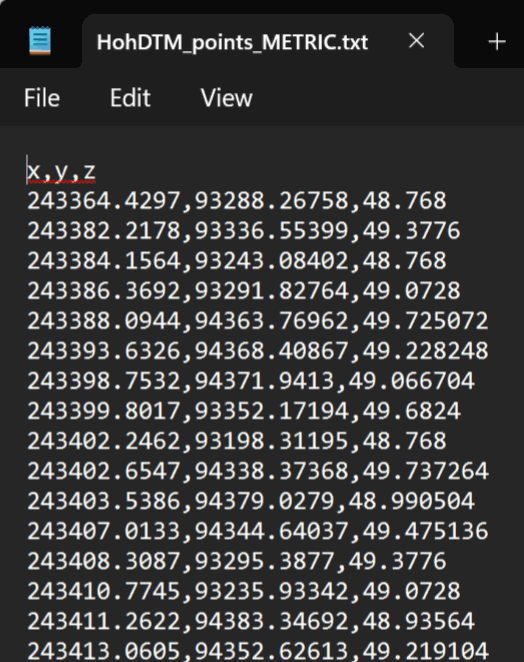
The X Y Z file can be formatted as comma, space or tab delimited data, where the first two columns correspond to point X and Y coordinates and the third column is the point elevation Z as shown in the following figure.
First, the X Y Z file is loaded to create an event layer. This can be accomplished as follows:
-
From the Layer menu, click Add Layer, and then click Add Delimited Text Layer... Alternatively, you may also click the Add Delimited Text Layer button:

-
Open the elevations file: Click the Browse [...] button and go to
'\ExampleProjects\InterpolatingRasterTutorial\base\HohDTM_points_xyz.txt'.
-
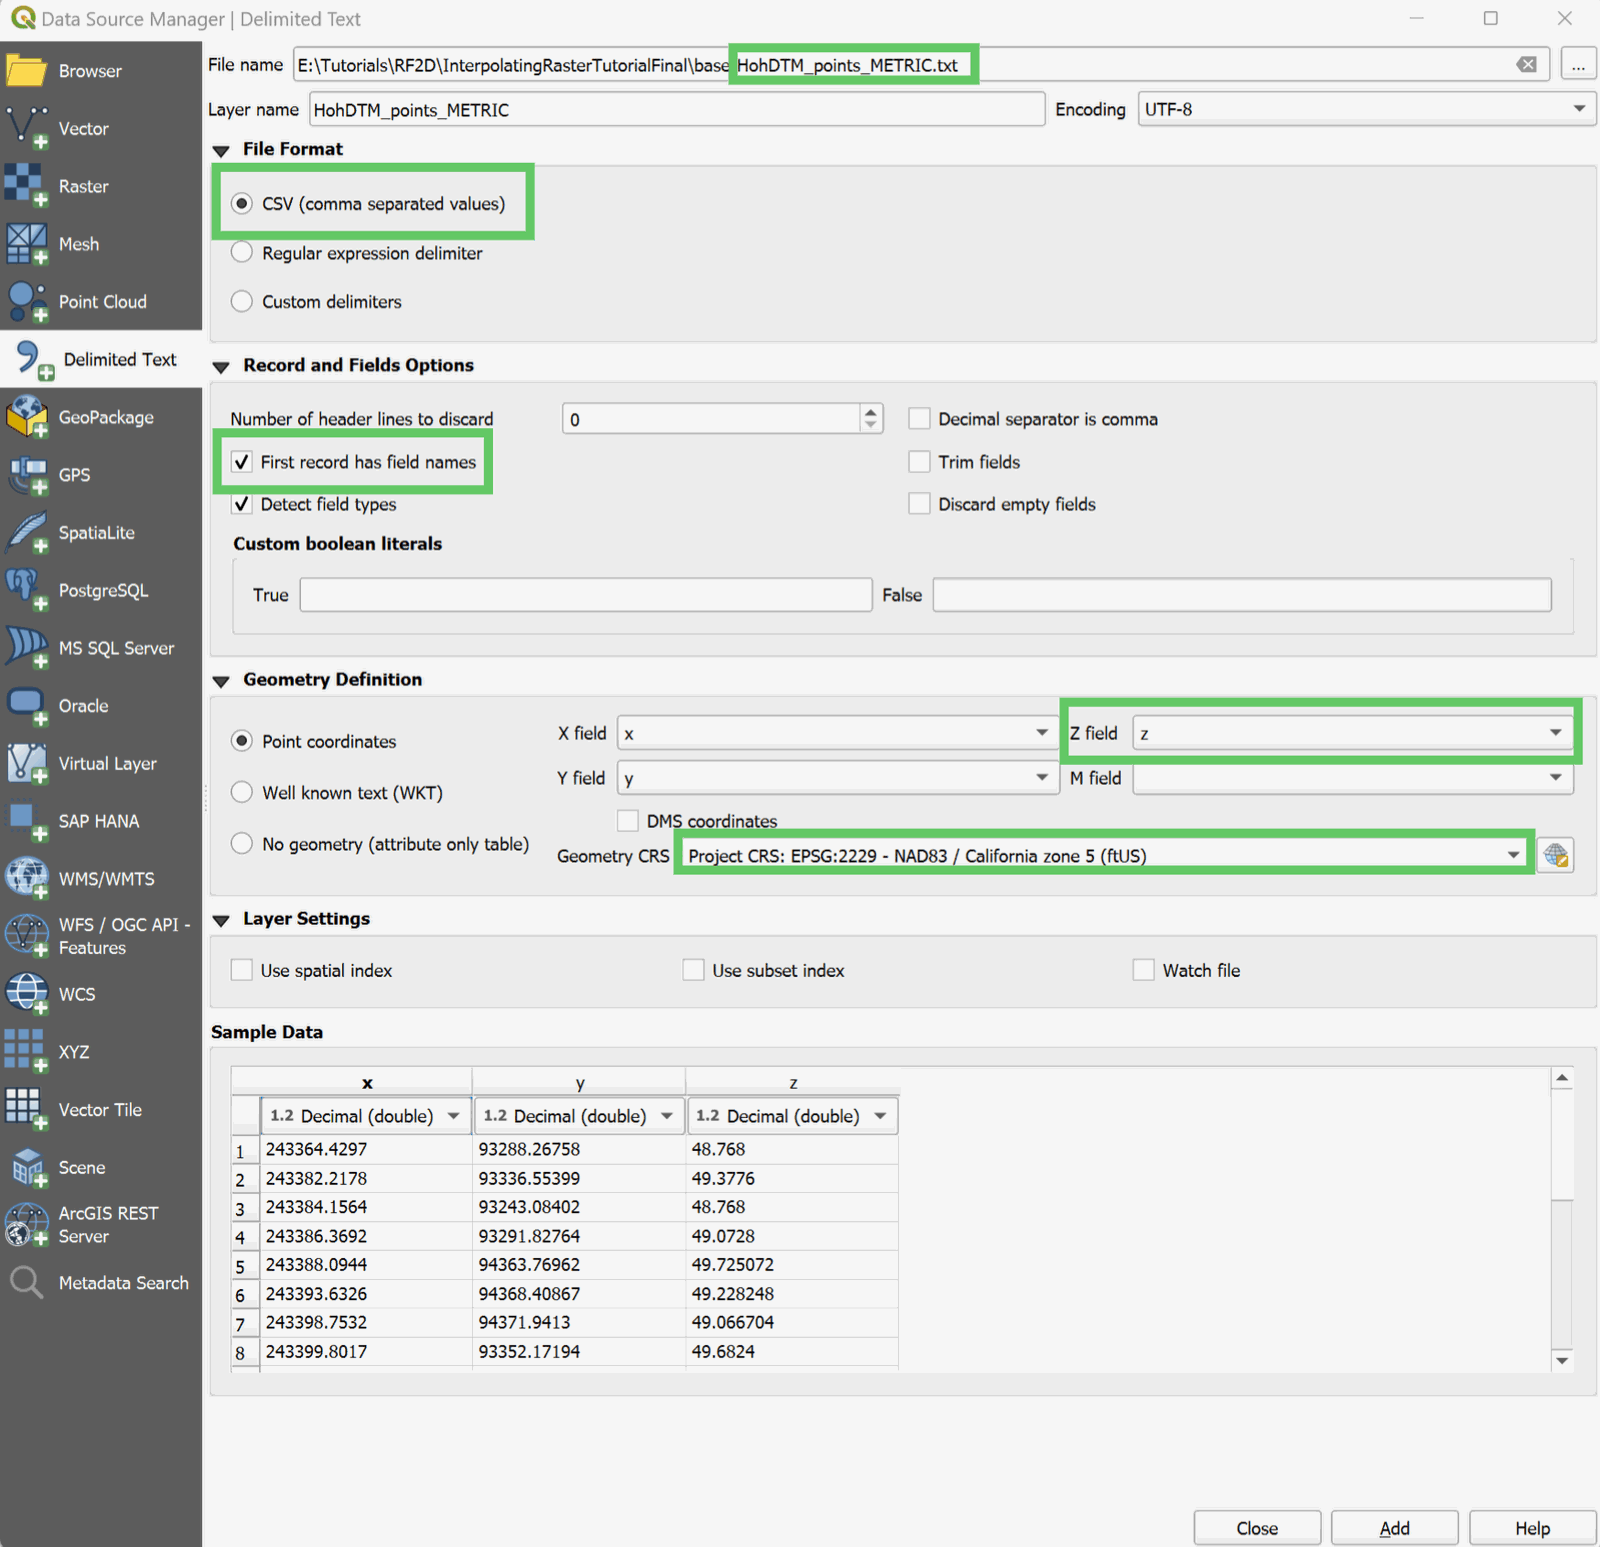
Under File format, Comma Separated Values should be selected.
-
Under Record and Fields Options the checkboxes First row contains field names should be selected.
-
Under Geometry Definition, click on the Z field dropdown and select z.
-
The Geometry CRS dropdown should be set to Project CRS: EPSG:2229.
The dialog should look like the following figure:
-
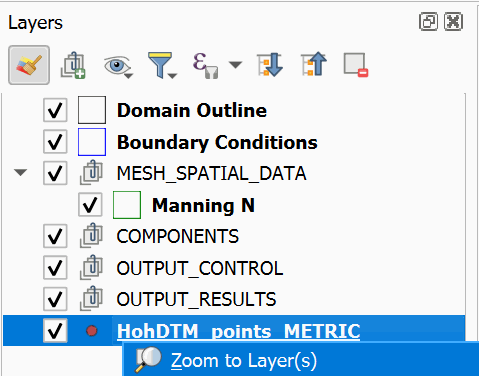
To go to the area where the points are located, you will have to right-click on the label of the created layer and select the option Zoom to the layer.
-
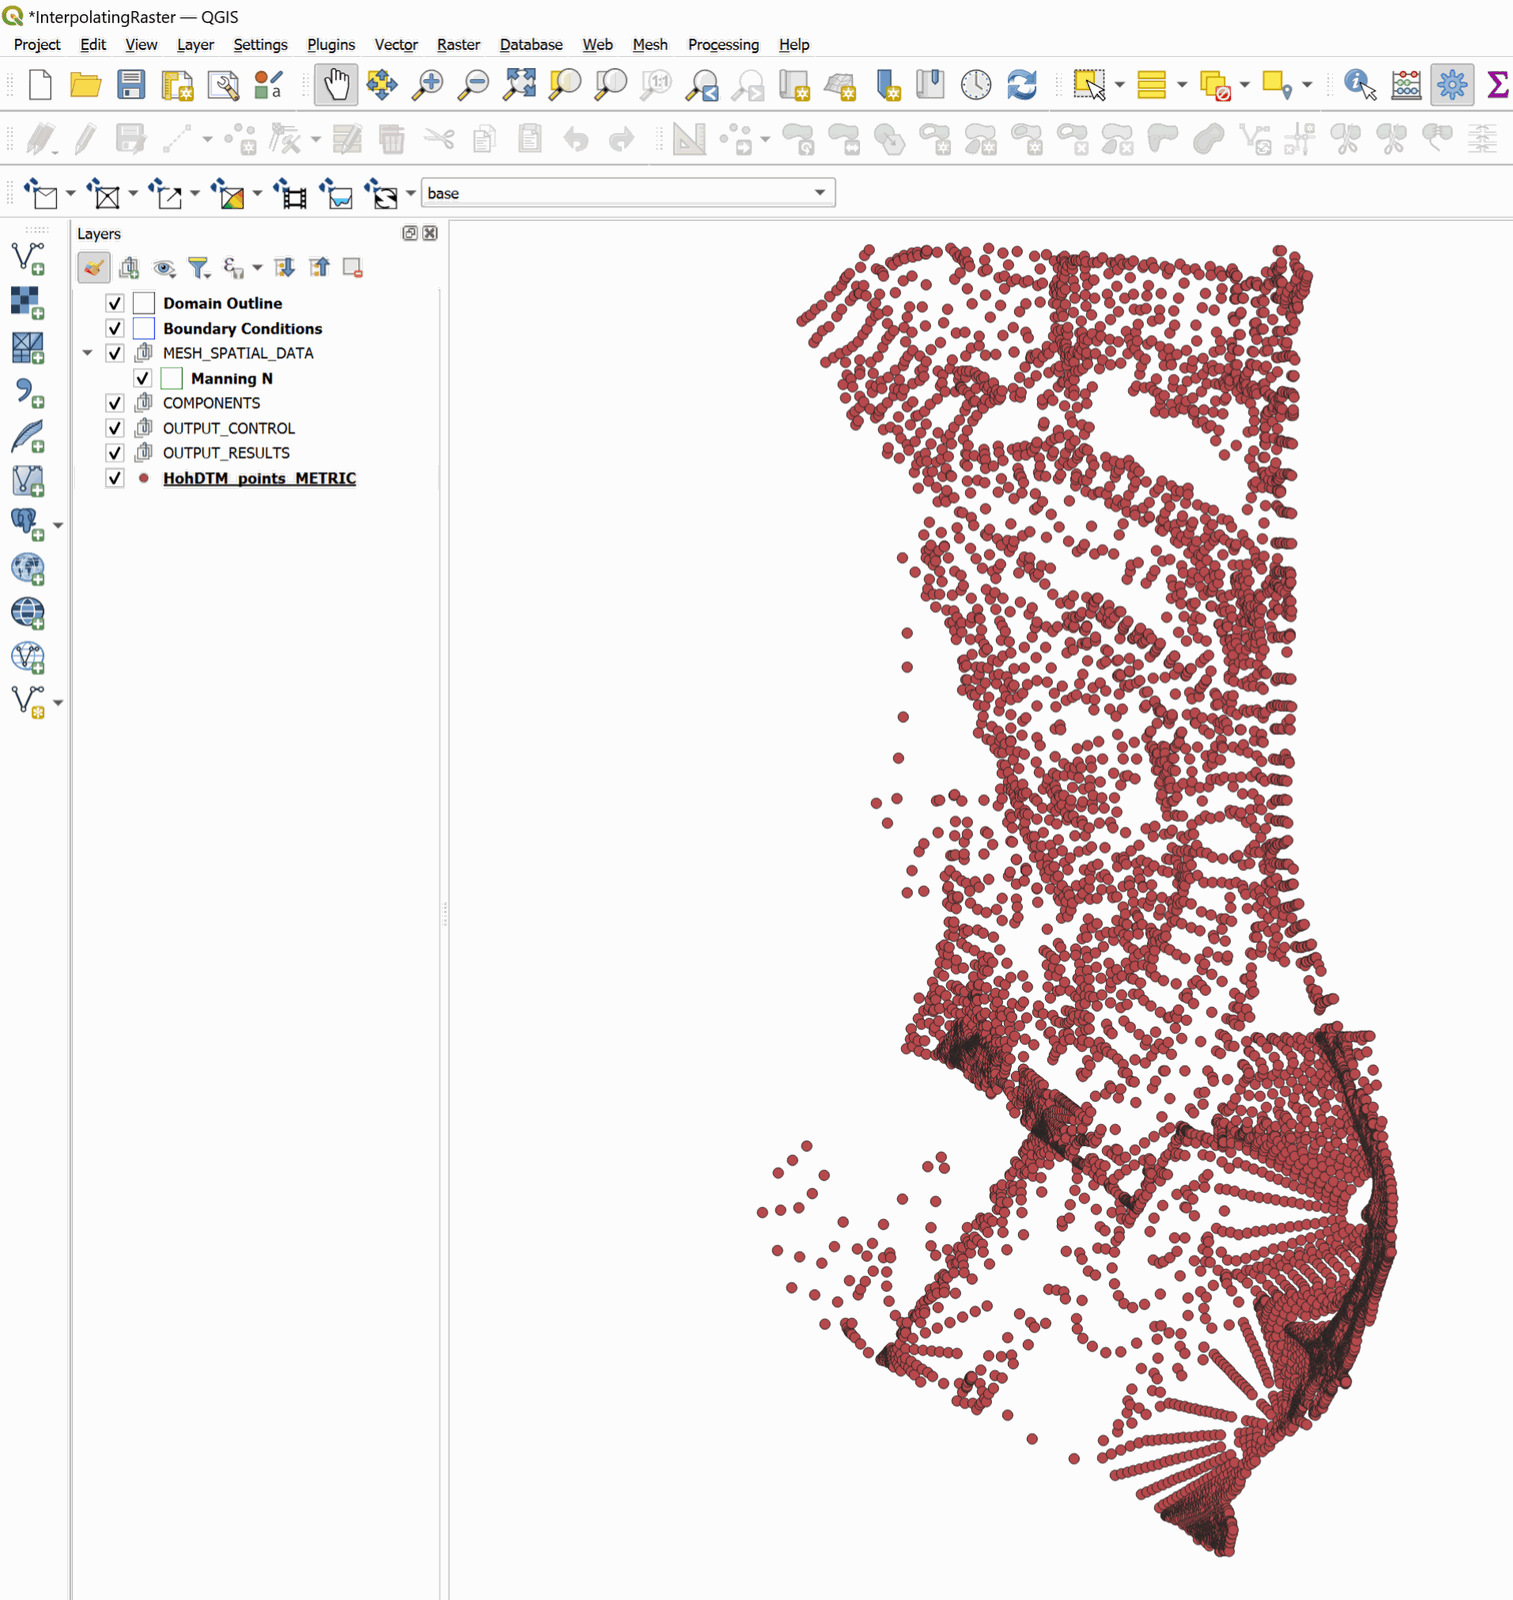
The points should appear in the project window:
-
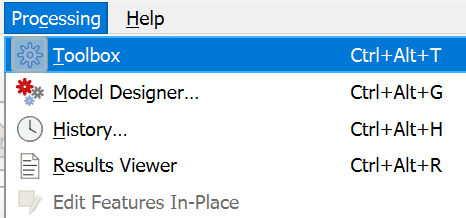
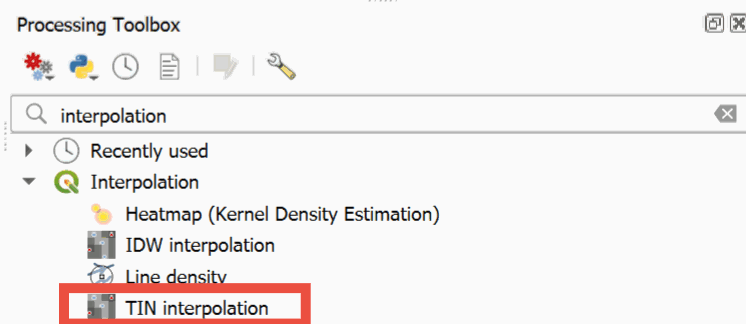
The raster is created interpolating from the data in the point layer. For that we will use the Processing Toolbox to load the panel that will allow us to search for the TIN interpolation command.
-
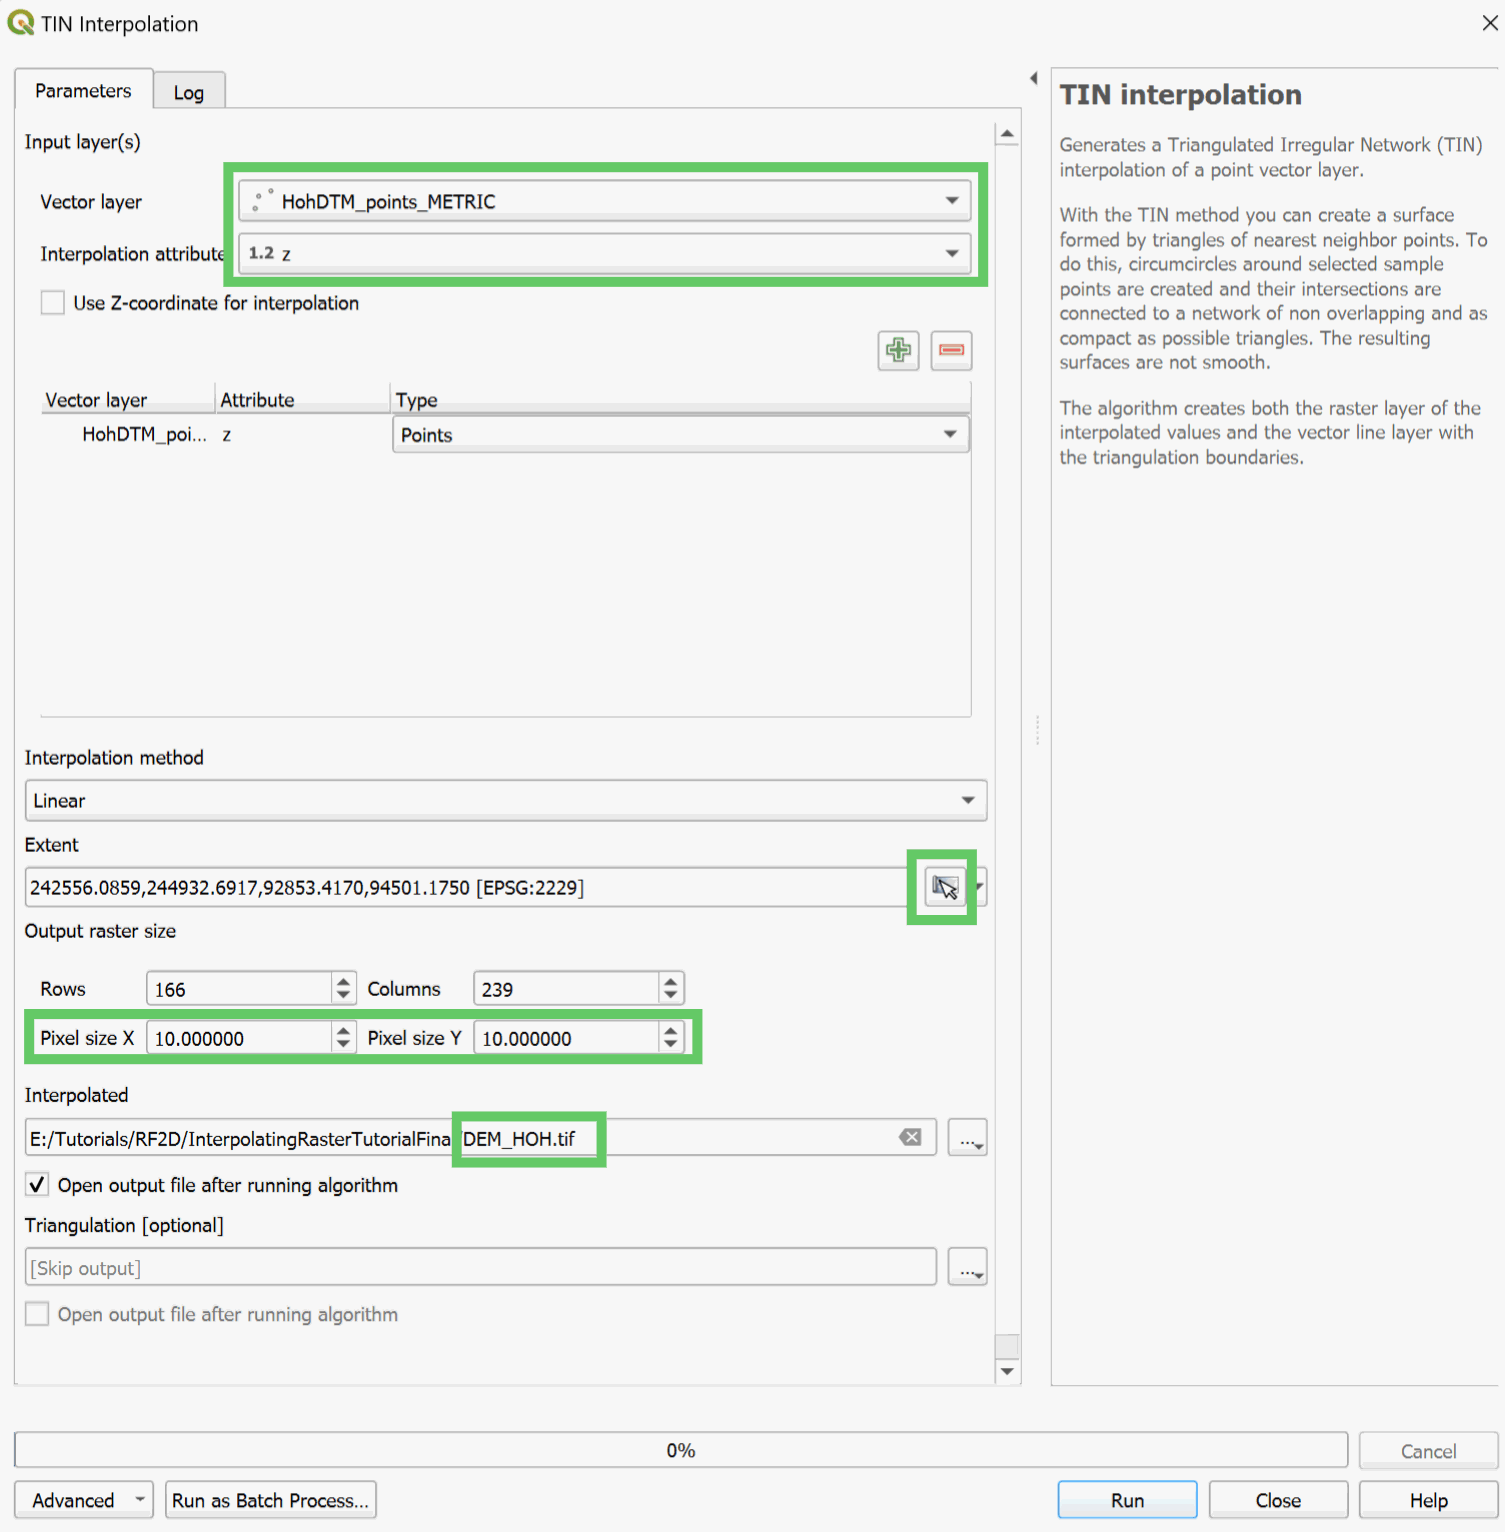
In this window select the layer to be interpolated to create the raster, in this example we use the point layer that we just created named HohDTM_points_METRIC. Change it by selecting the dropdown for Vector layer.
-
We select the field that has the attribute that was used as the value to interpolate, in this case the z field. This is done by clicking the dropdown for Interpolation Attribute, and select z.
-
Click the green + button to add the vector layer into the list.
-
Click on the Set to current map canvas extent button and it shoudl automatically fill in the extent information.
-
In the Pixel size textboxes, enter 10. You will notice the Rows and Columns textboxes are automatically filled in based on the pixel size.
-
Select the path to the folder where the raster layer is to be created. It is recommended to point to the project folder directory chosen earlier in the tutorial.
The panel should look like the following figure:
-
Click OK to start the interpolation process.
Once the process is completed, the raster resulting from the interpolation will be displayed on the screen, by default it is rendered in gray gradient as shown in Figure 19.8.
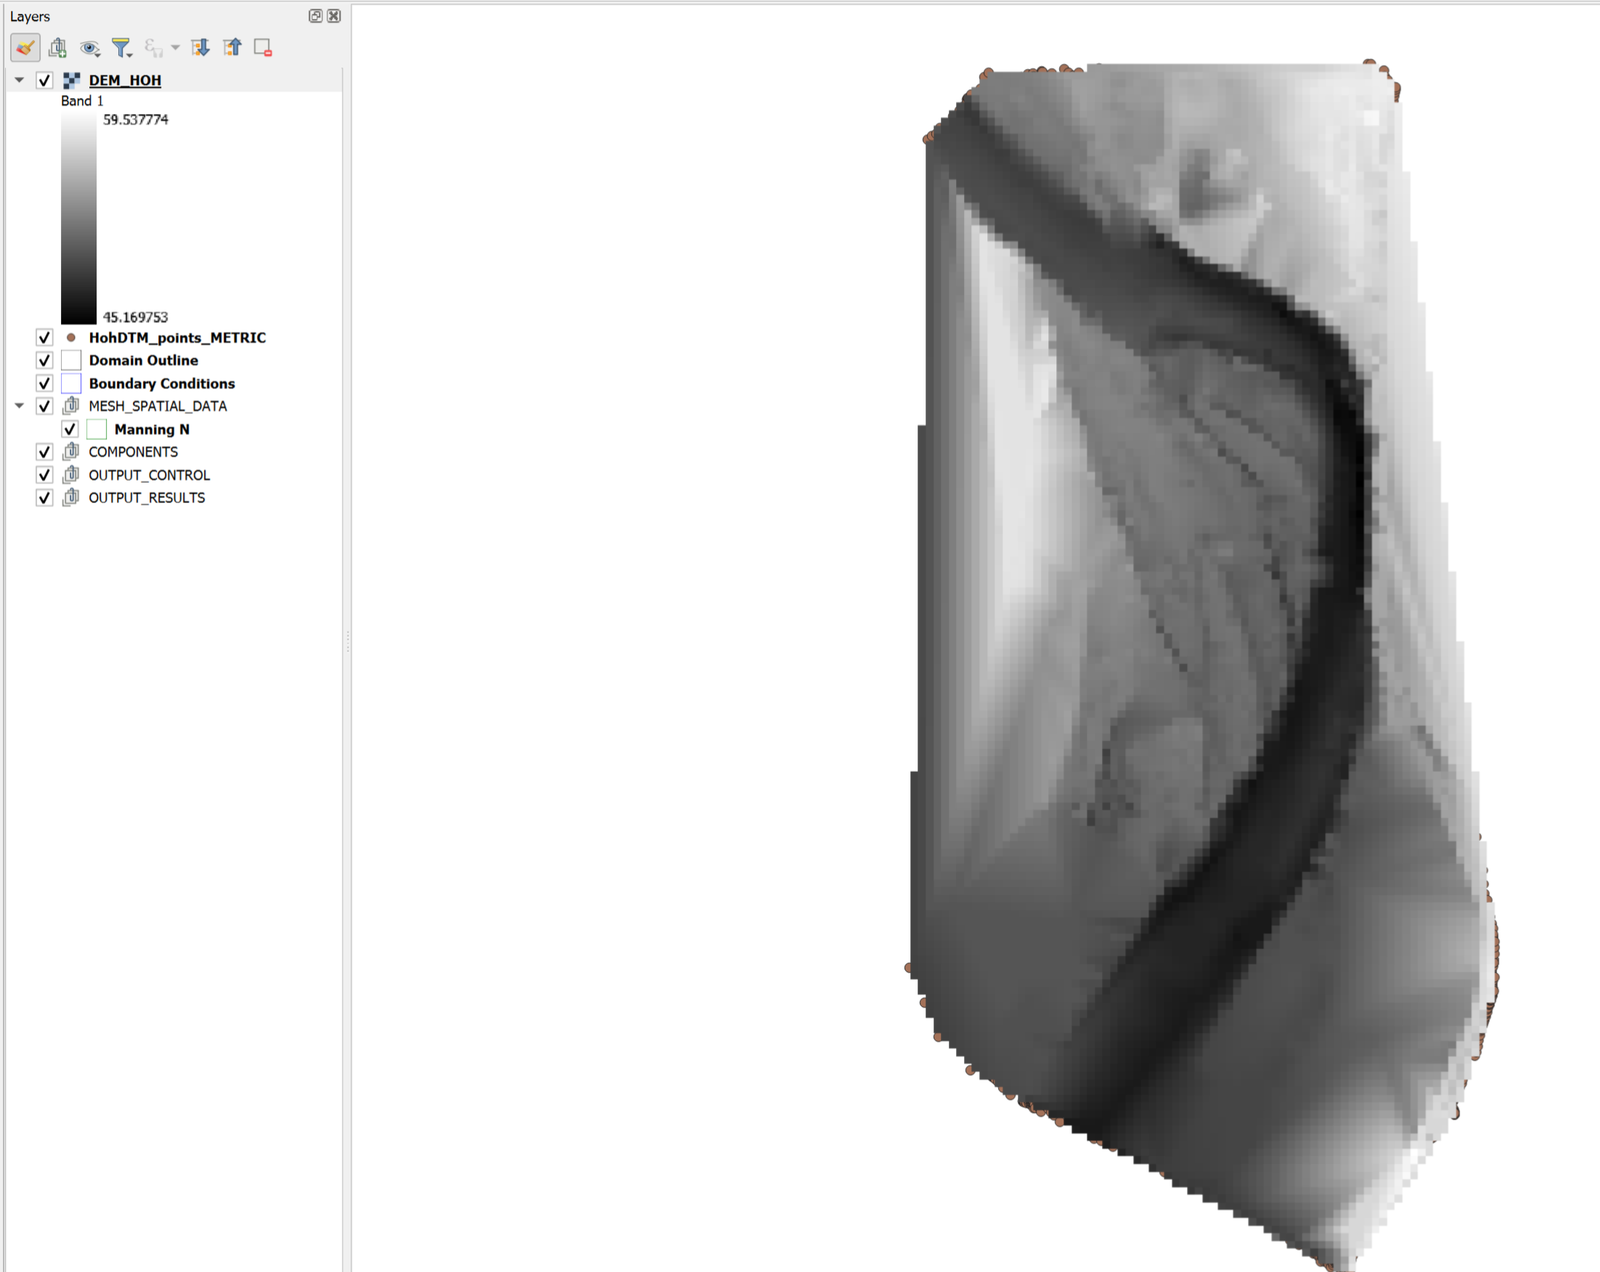
::: shaded Note: Right-clicking on the label of the created layer and selecting Properties allows you to change the rendering style for a more informative color palette. :::
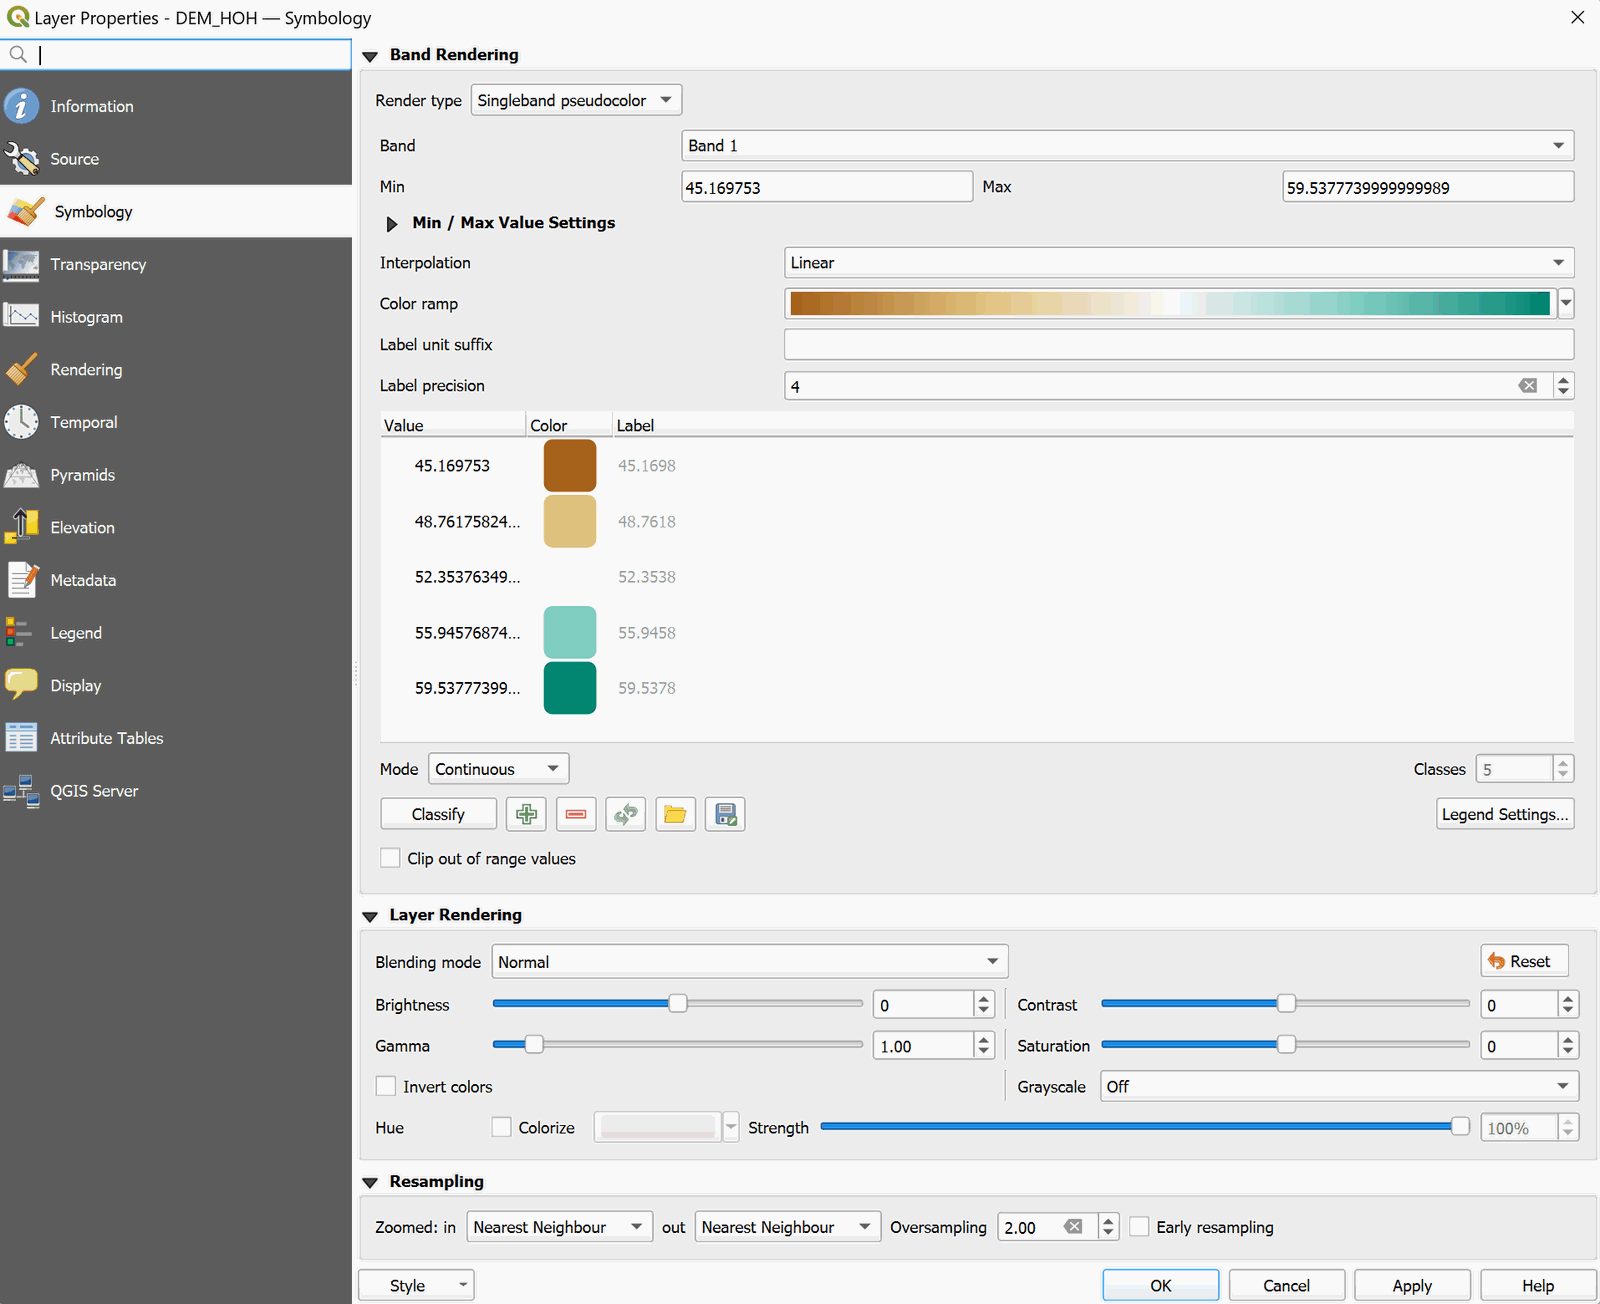
And now the raster layer is displayed with the new color palette selected:
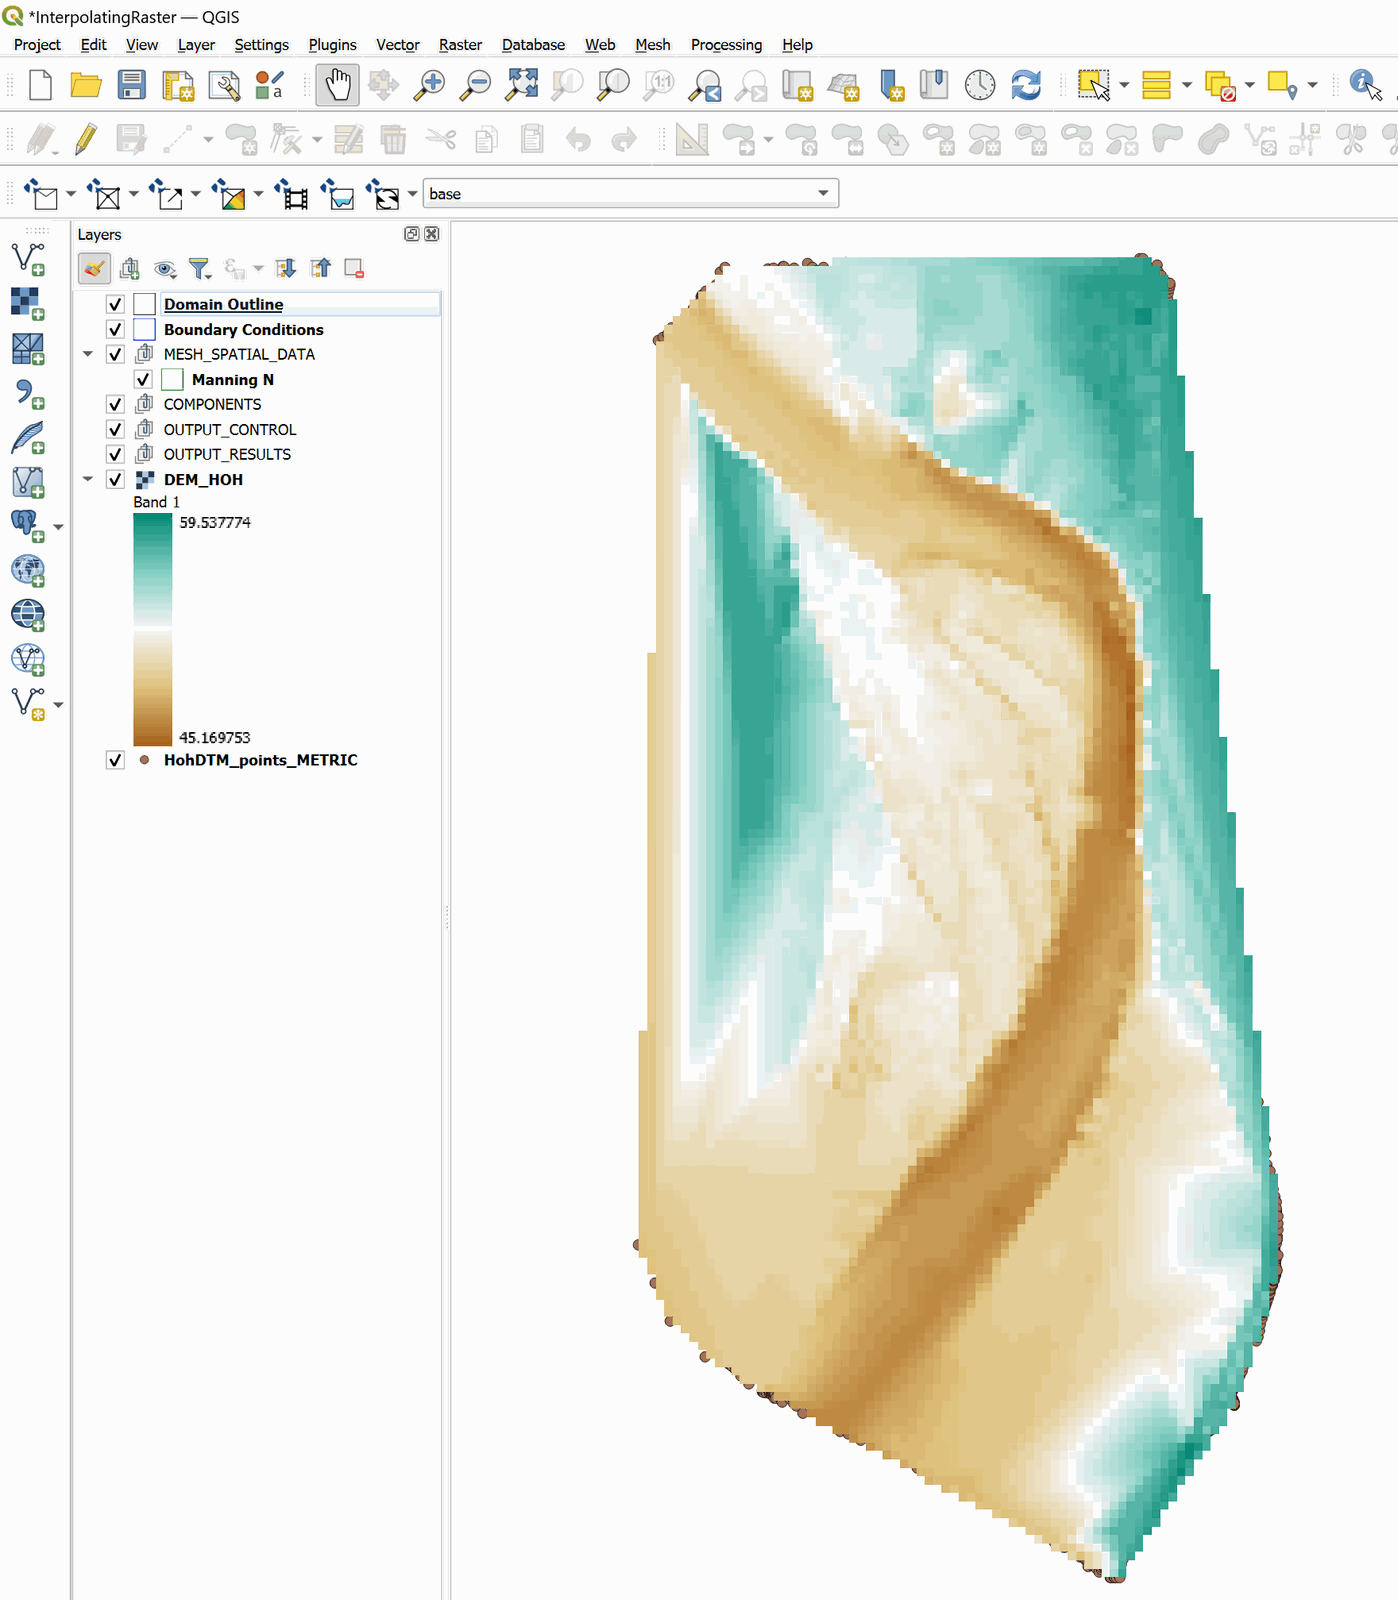
::: shaded It is convenient to move the raster layer created to the end of the list of layers, thus it does not interfere with the display of other layers. :::
This concludes the Interpolating Raster tutorial.