Simulating dam breaches
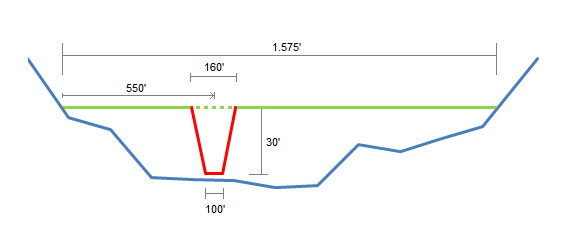
This tutorial illustrates how to incorporate dam breach simulation into an existing RiverFlow2D project using the QGIS interface. The exercise consists of modeling the a dam break flood. The dam is approximately 1575 feet long, the breach center is 550 feet from the right margin of the dam, the opening of the breach has the final dimensions shown in the following Figure, a top width of 160 feet, and at the bottom width of 100 feet, the final breach height is 30 feet.
For this exercise, a file with the time evolution of the breaching dimensions is required, this file can be prepared before setting the model or it can be created when entering the input the parameters. The procedure to model the dam break involves the following steps:
-
Open an existing RiverFlow2D project.
-
Create a DamBreach layer and to draw a line that represent the transverse axis of the dam.
-
Generate the mesh.
-
Run the model.
-
Review the output files.
::: shaded The files required to follow this tutorial can be extracted from the 'ExampleProjects' zip file under the 'DamBreachTutorial' folder. This zip file is downloaded separately from your installation materials. :::
Open an existing project
-
Open QGIS
-
On the Project menu click Open... and browse to the existing project: .
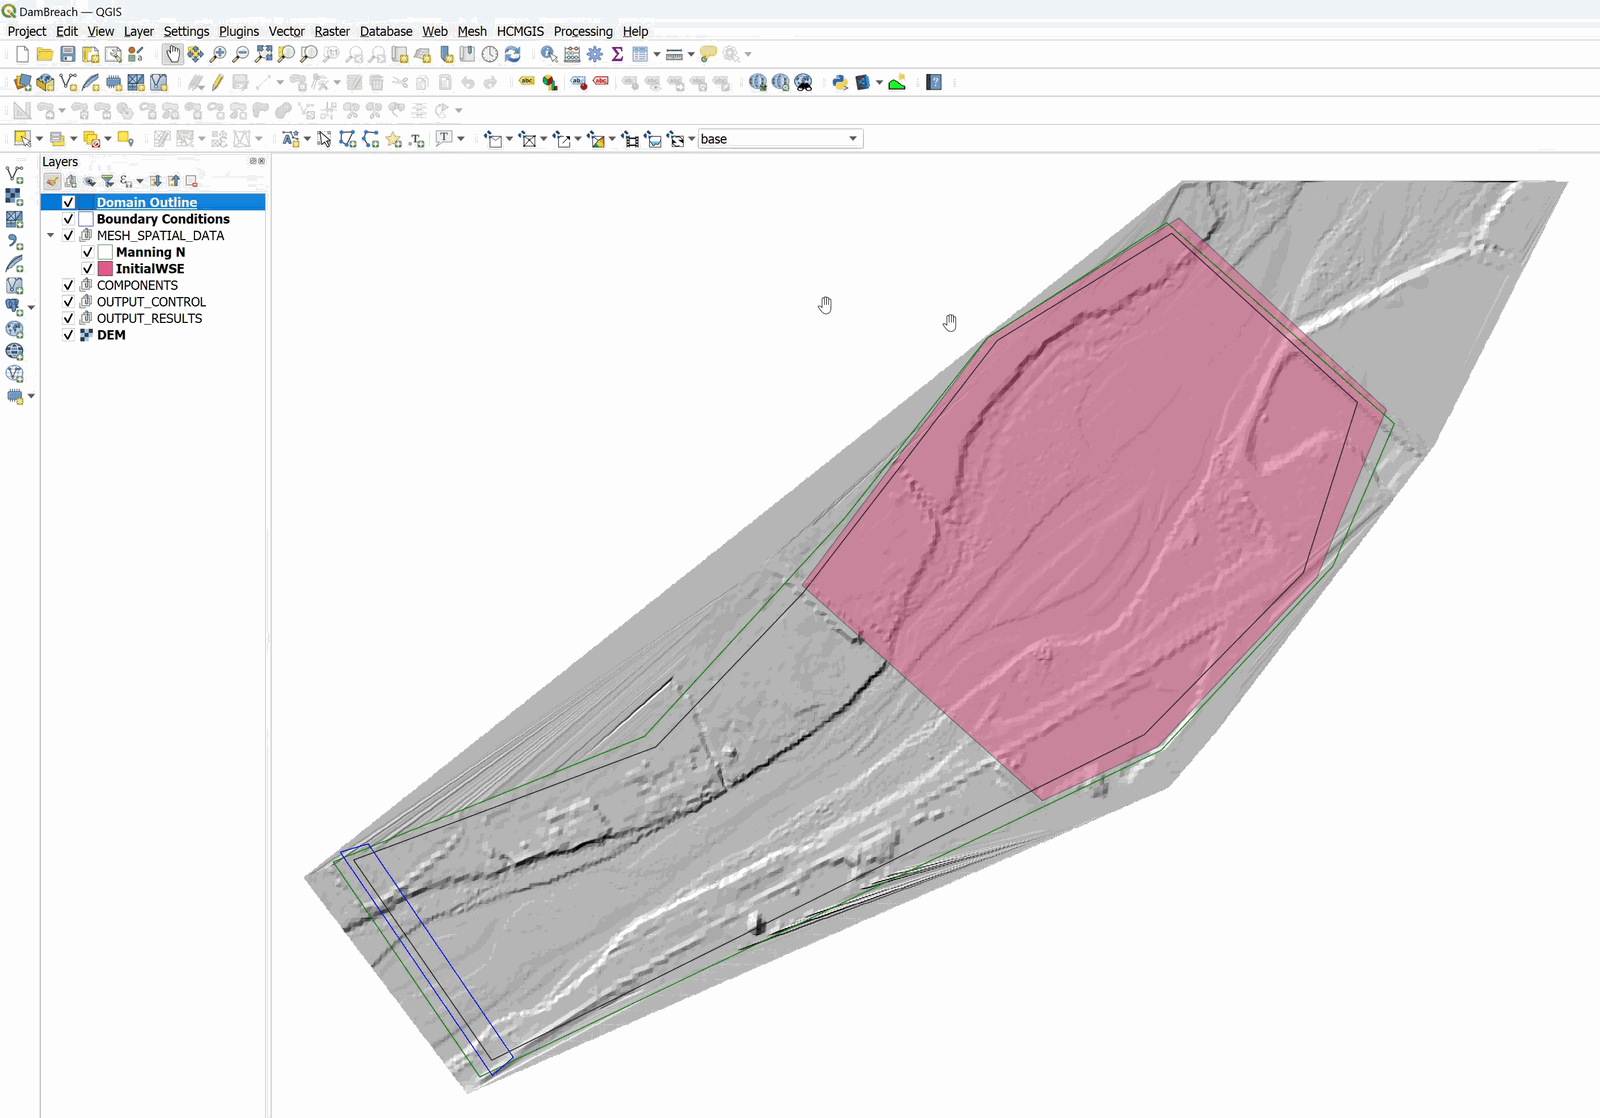
This project contains the Domain Outline layer, the digital elevation model DEM of in raster format, outflow conditions are set to free outflow in the lower left, and an initial condition of water surface elevation behind the dam. Figure 7.2 shows the project in QGIS.
Create the DamBreach layer and draw the line that defines the dam
Creating the dam involves the following steps:
-
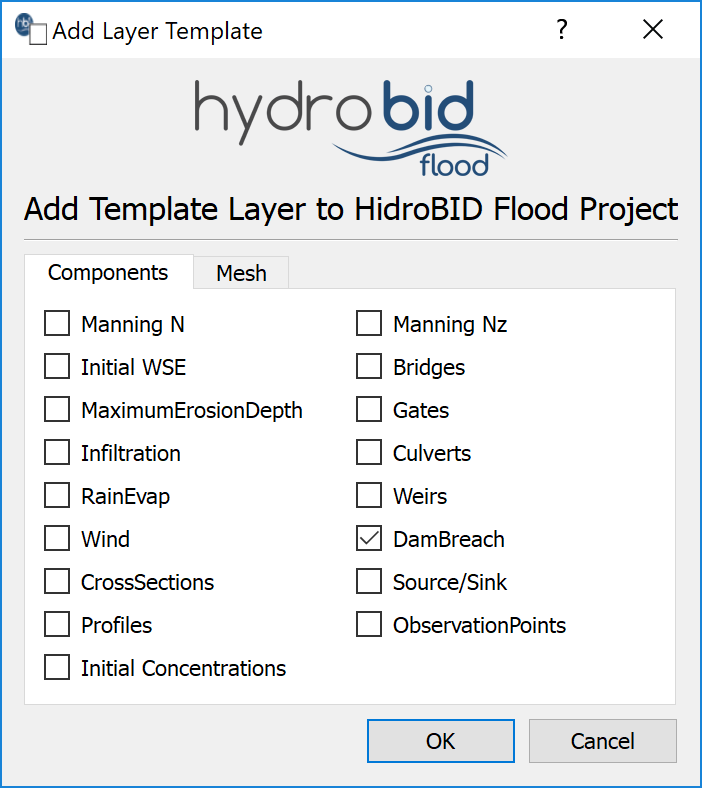
Create the template for the DamBreach layer: in the RiverFlow2D toolbar click on the New Template Layer button

-
In the dialog select DamBreach, as shown in the figure below:
-
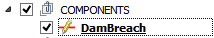
Edit the DamBreach layer: In the layers panel, select the DamBreach layer.
-
In the digitalization toolbar we click on the Toggle Editting button

A pencil icon will appear in the DamBreach layer, indicating that the layer is in edit mode:
-
Draw the line that defines the axis of the dam: Using the Add Feature tool of the digitalization toolbar

-
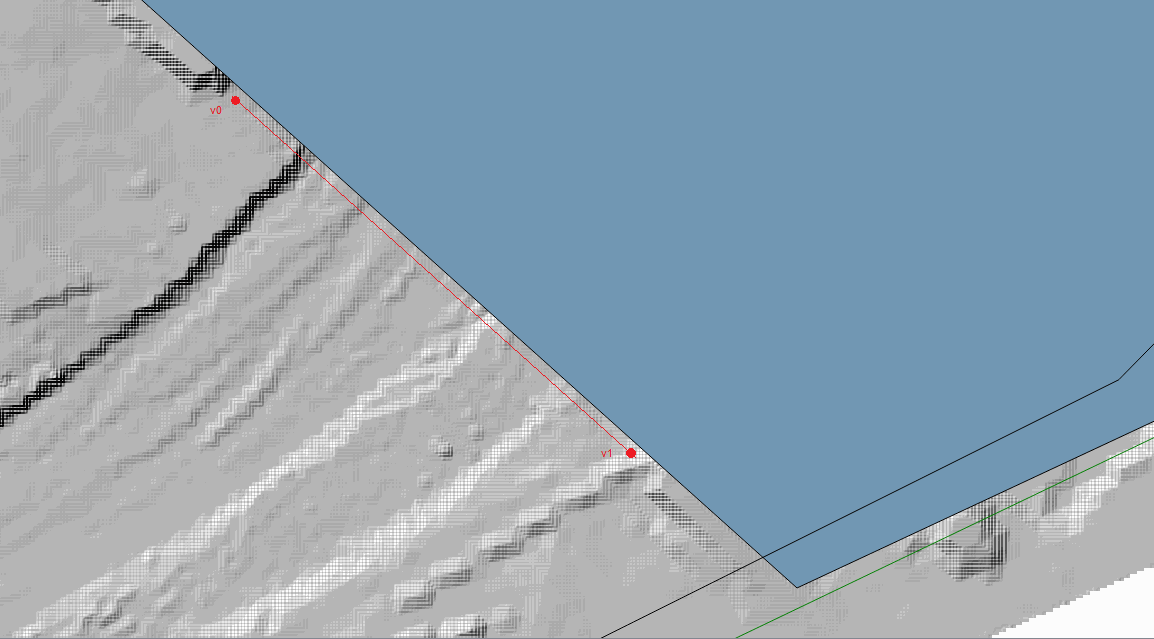
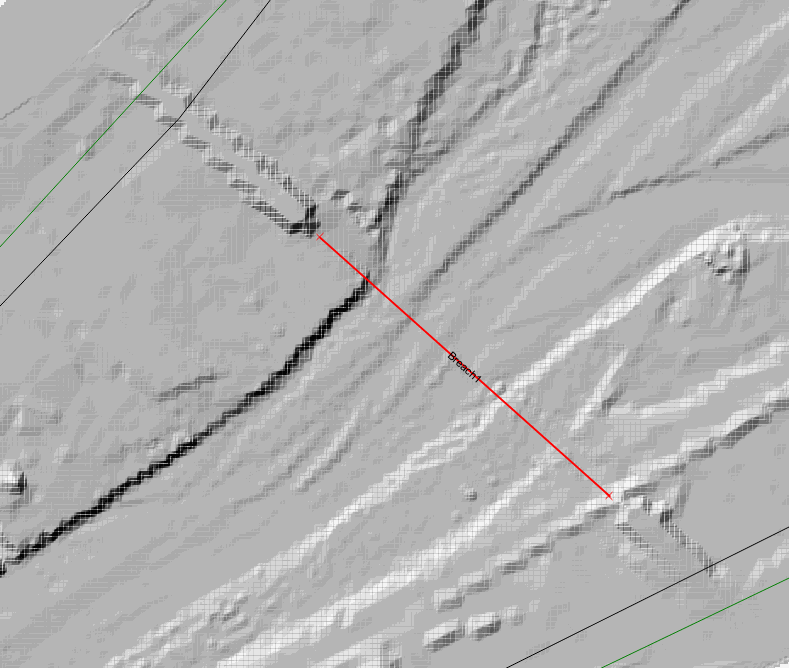
Draw the line that defines the dam axis. Keep in mind that the breach centroid is measured from the first vertex of the dam line. In this example it occurs 550 feet from the left margin of the dam (Figure 7.1). The dam axis is drawn from the top of the channel (point v0) to the bottom (point v1) along one side of the polygon that defines the initial water surface elevation, as illustrated in the image below.
-
Once finished drawing the dam axis, the window to input the parameters of the DamBreach appears.
-
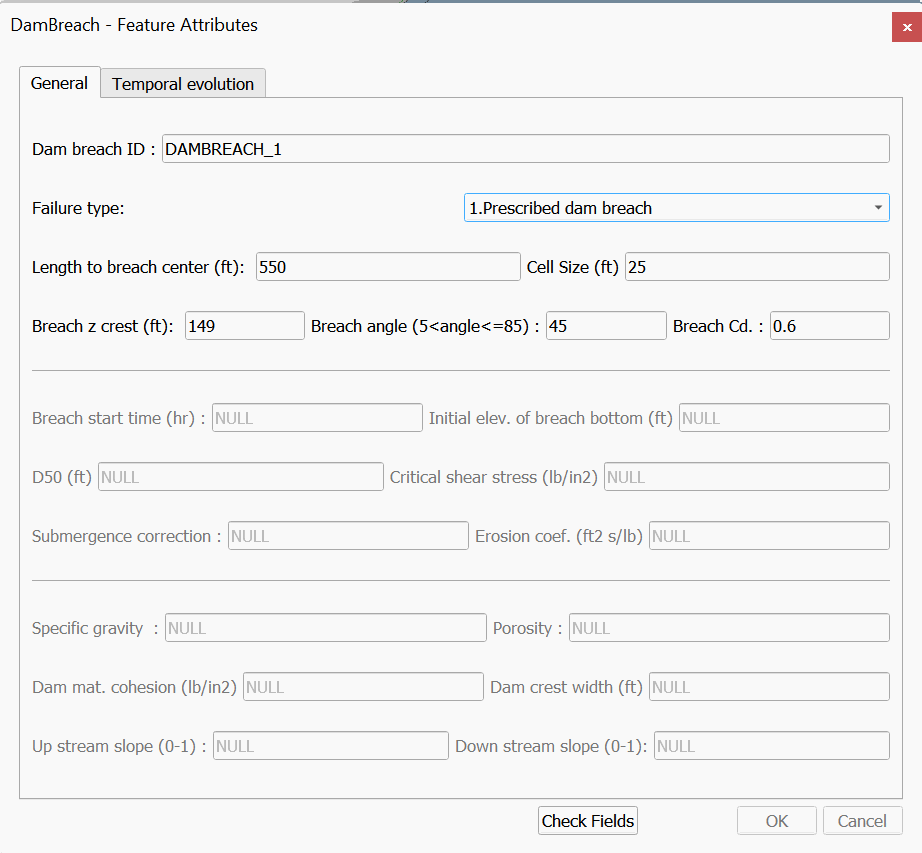
Input the information as seen below in the figure and click the Check Fields button:
-
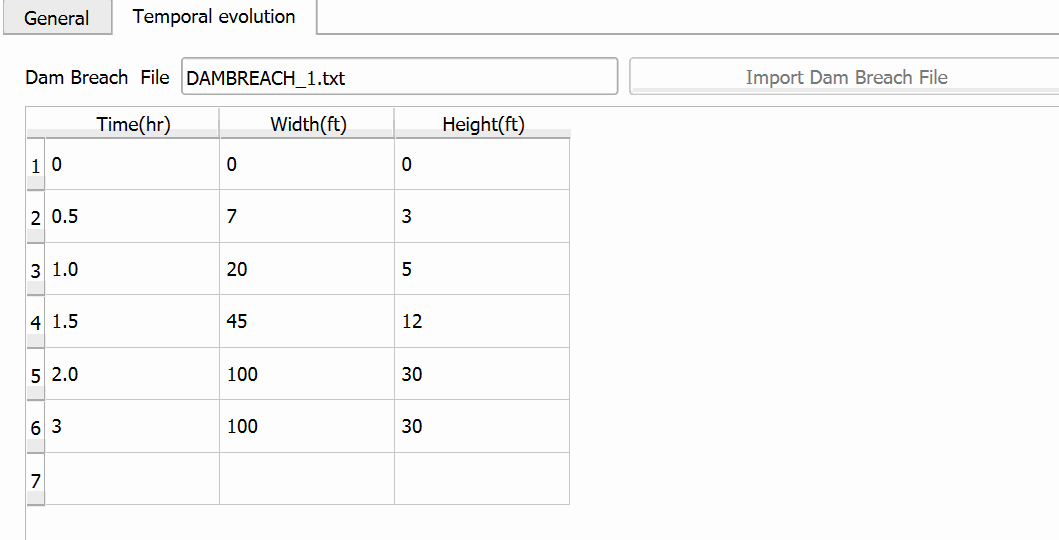
Click the Temporal evolution tab and click on the Import Dam Breach File button. Select the 'DAMBREACH_1.txt' file in the scenario folder. Click OK to close.
-
The temporal evolution of the 'DAMBREACH_1.TXT' file is shown in the Temporal evolution tab below:
Generate the mesh
The mesh is generated using the Generate TriMesh tool

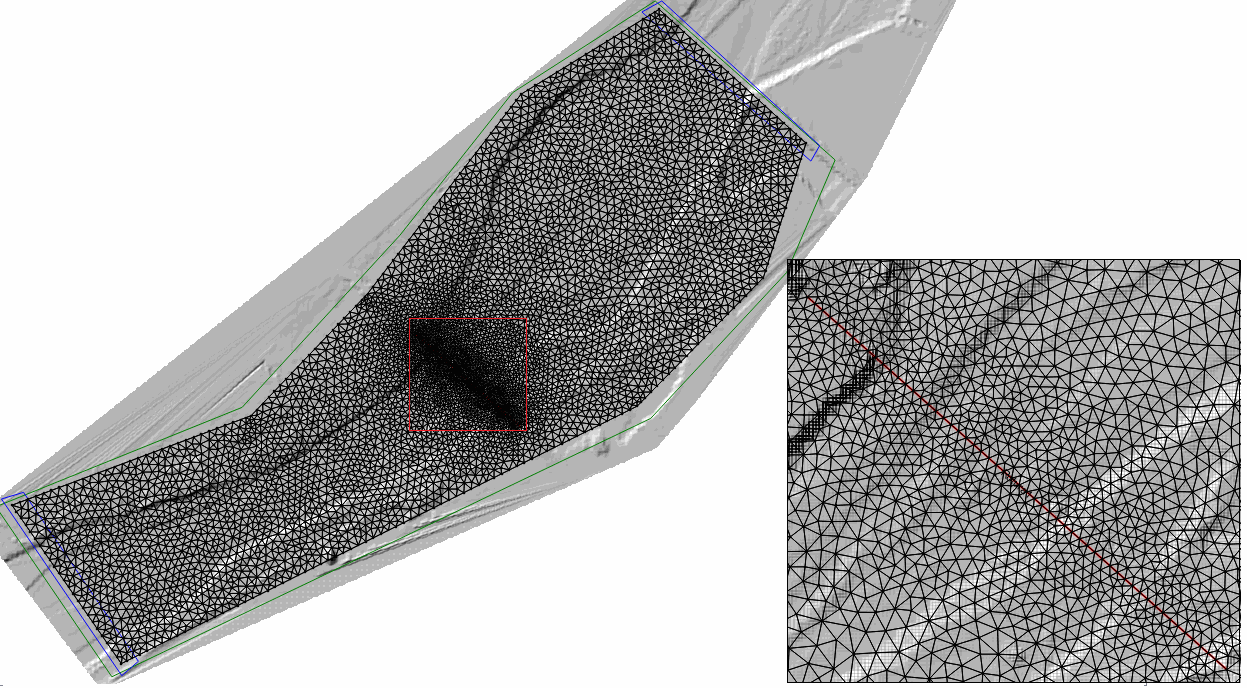
Figure 7.8 shows the resulting mesh of almost 11,000 cells
Exporting files to RiverFlow2D
-
Click on the *Export RiverFlow2D * button.

-
Select the raster layer that contains the Digital Elevation Model (DEM) and the name of the project.
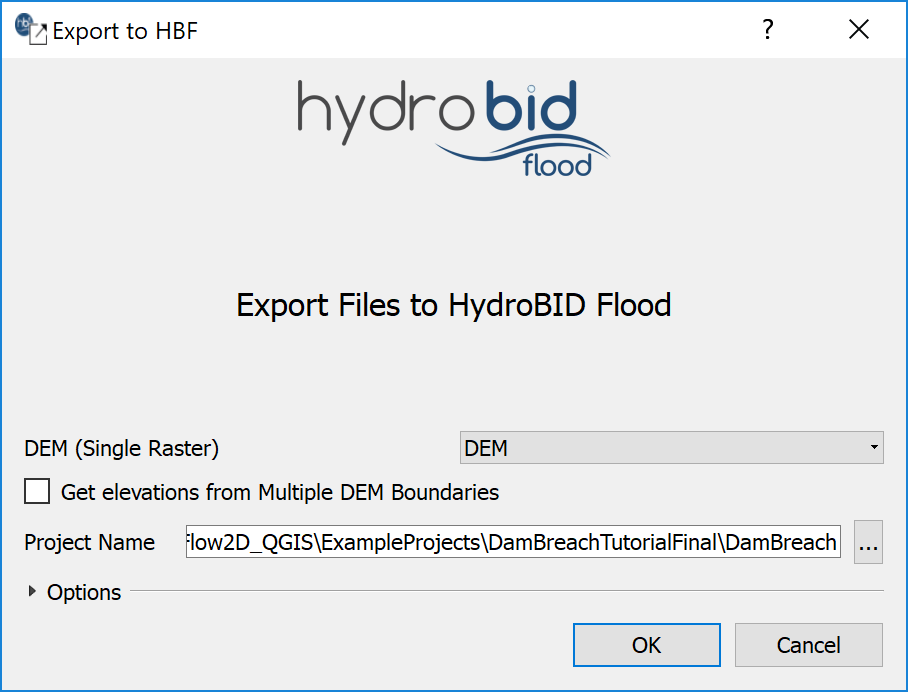
-
Once finished, click on the OK button and the export process will begin. Once it is finished, RiverFlow2D will be loaded with the 'base.DAT' file.
Running the model
After exporting the files, Hydronia Data Input Program is loaded with the project file of the 'base.DAT' example and shows the Control Data panel as illustrated in Figure 7.10.
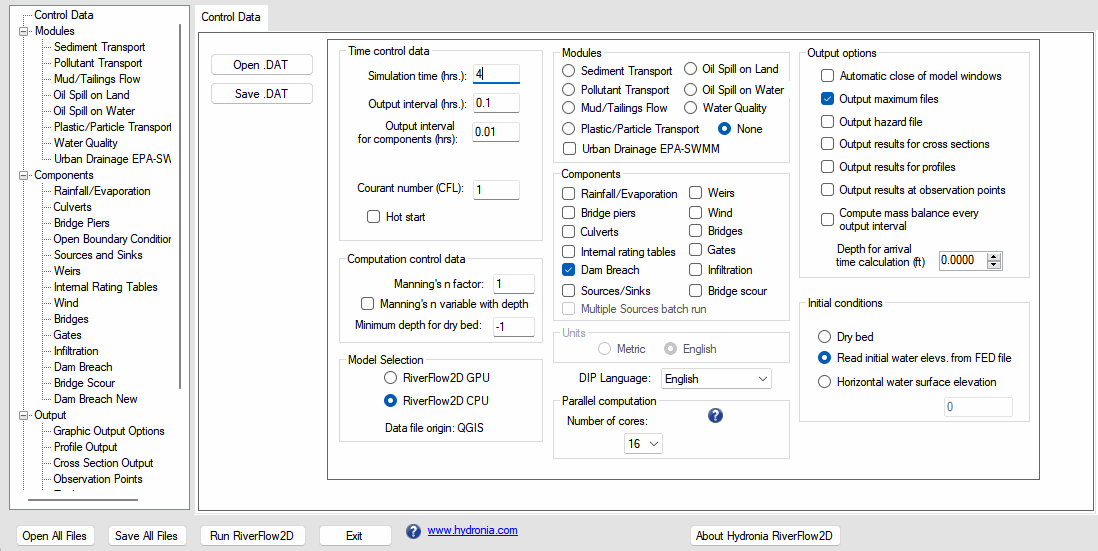
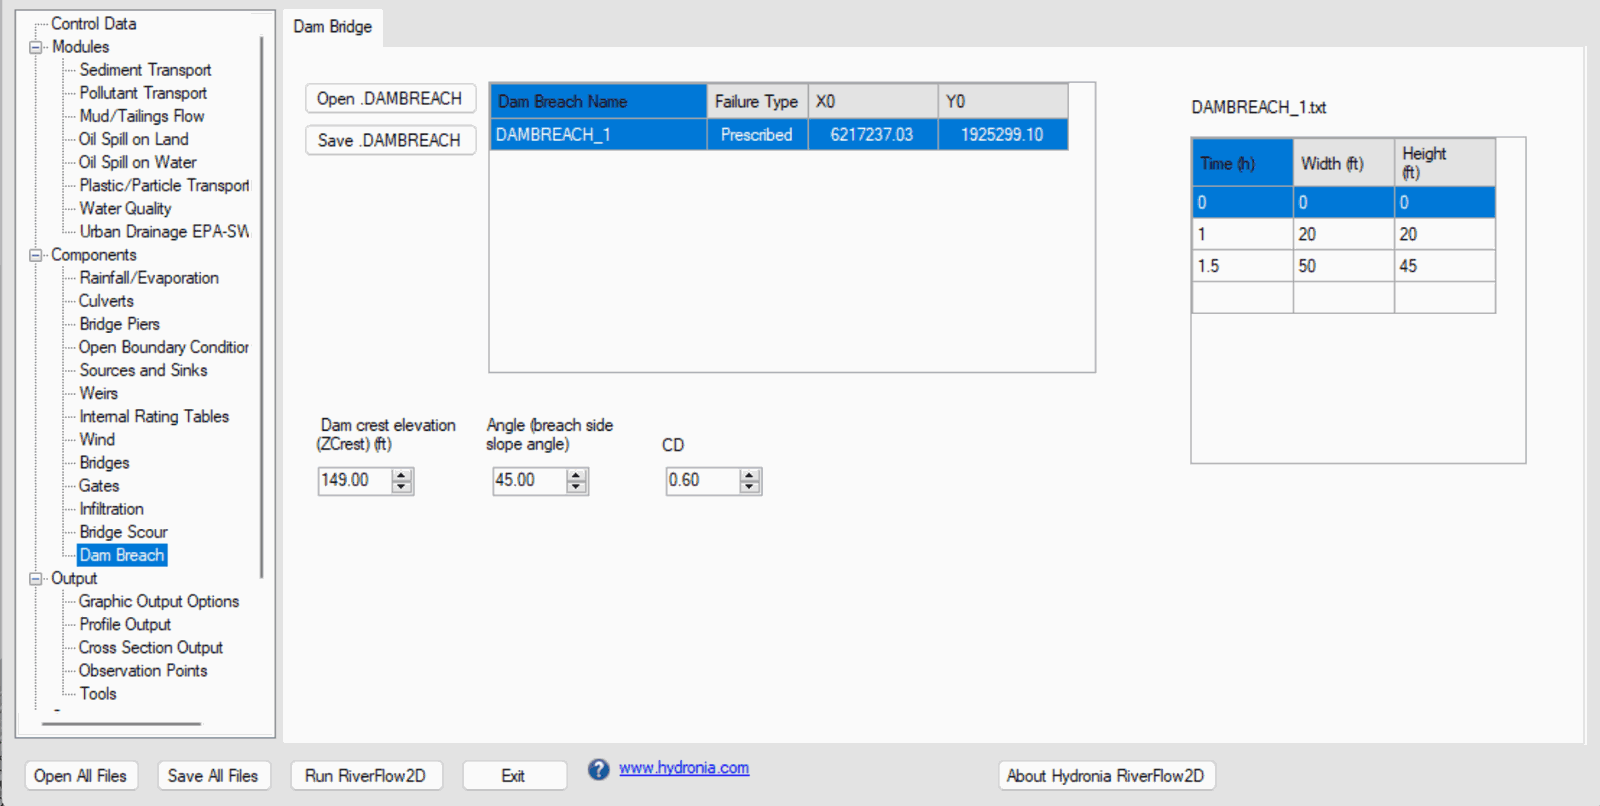
It can be seen that the Dam Breach component is selected as well as the initial condition that indicates that the initial elevation of the water surface of the '.FED' file will be read. Selecting from the list on the left panel the Dam Breach component will show the panel where you can see the parameters of the dam breach as shown in the figure below:
-
Before running the model, set the simulation time to 4 hours.
-
Leave all other parameters at their default values.
-
To run the model, click on the Run RiverFlow2D button in the lower section of Hydronia Data Input Program.
-
Save the changes with the same name as the 'DamBreach.DAT' file.
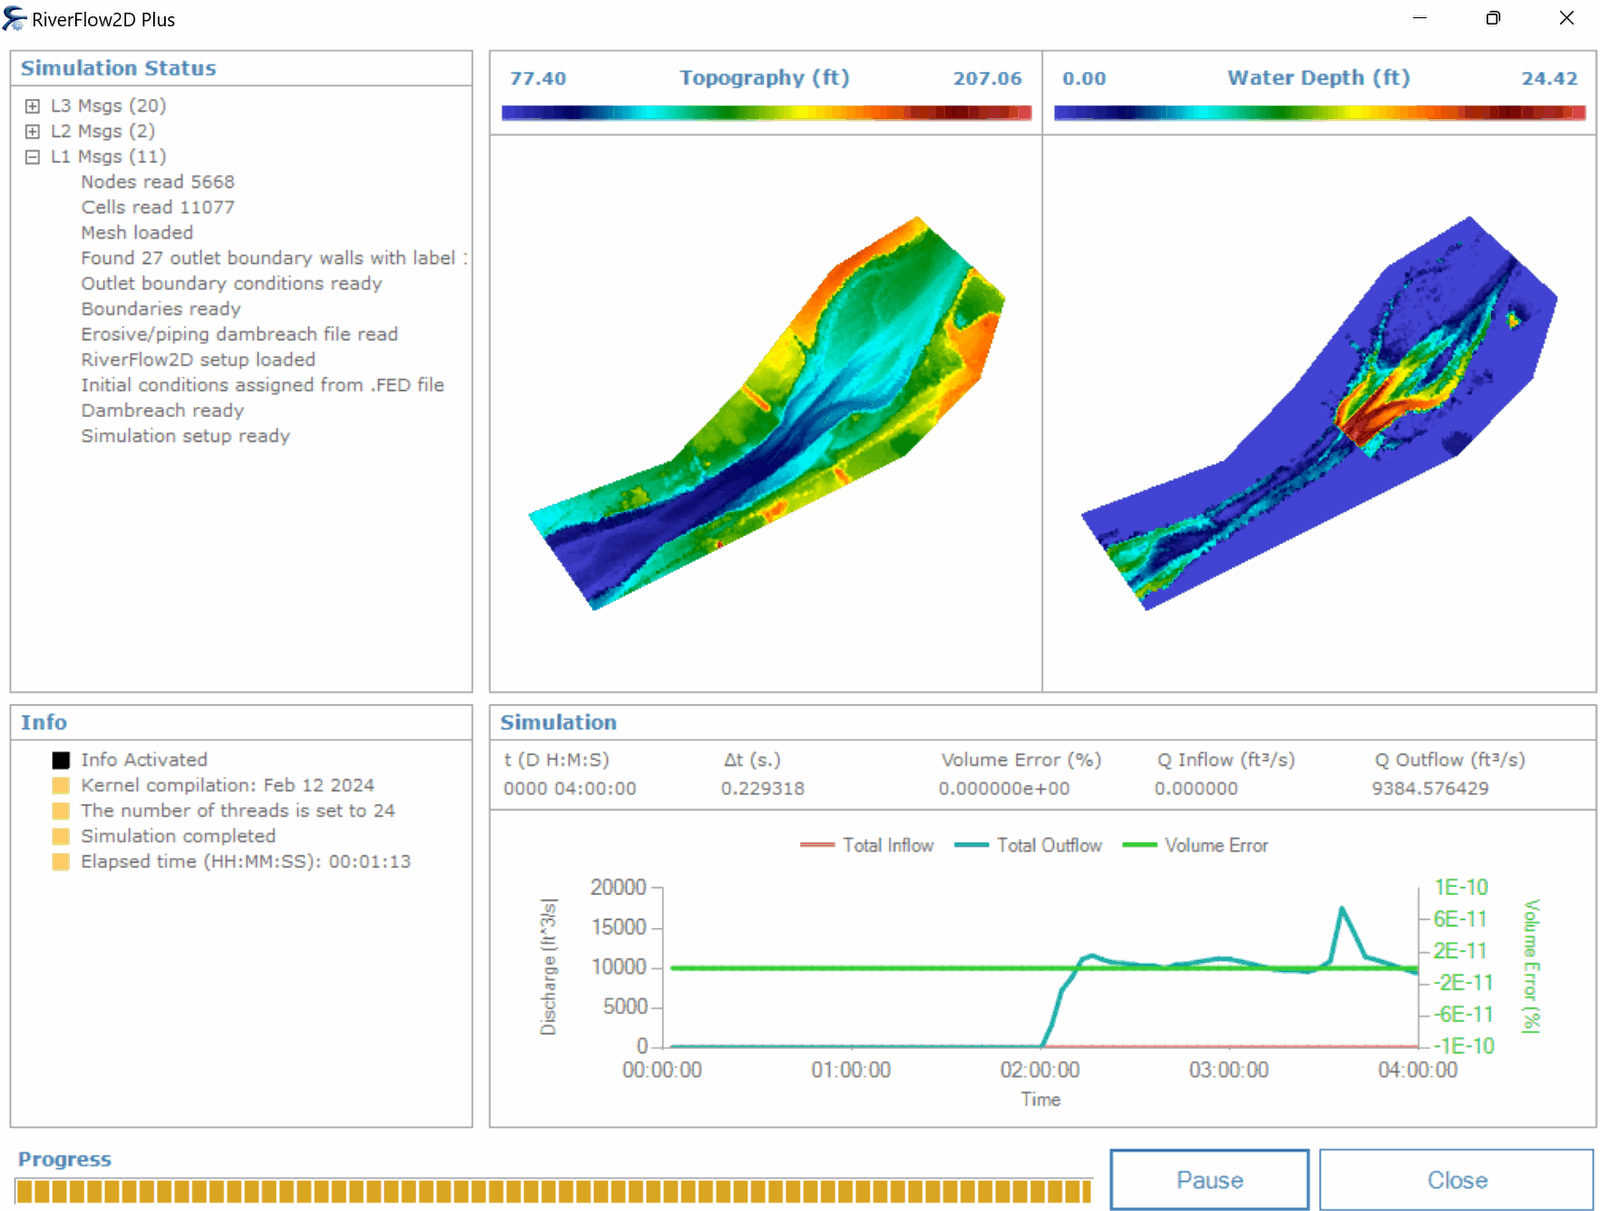
A window will appear indicating that the model has started running. The window that RiverFlow2D presents while running the model shows simulation time information, volume conservation error, the total input and output discharge as well as other parameters as execution progresses (Figure 7.12).
Review the output files
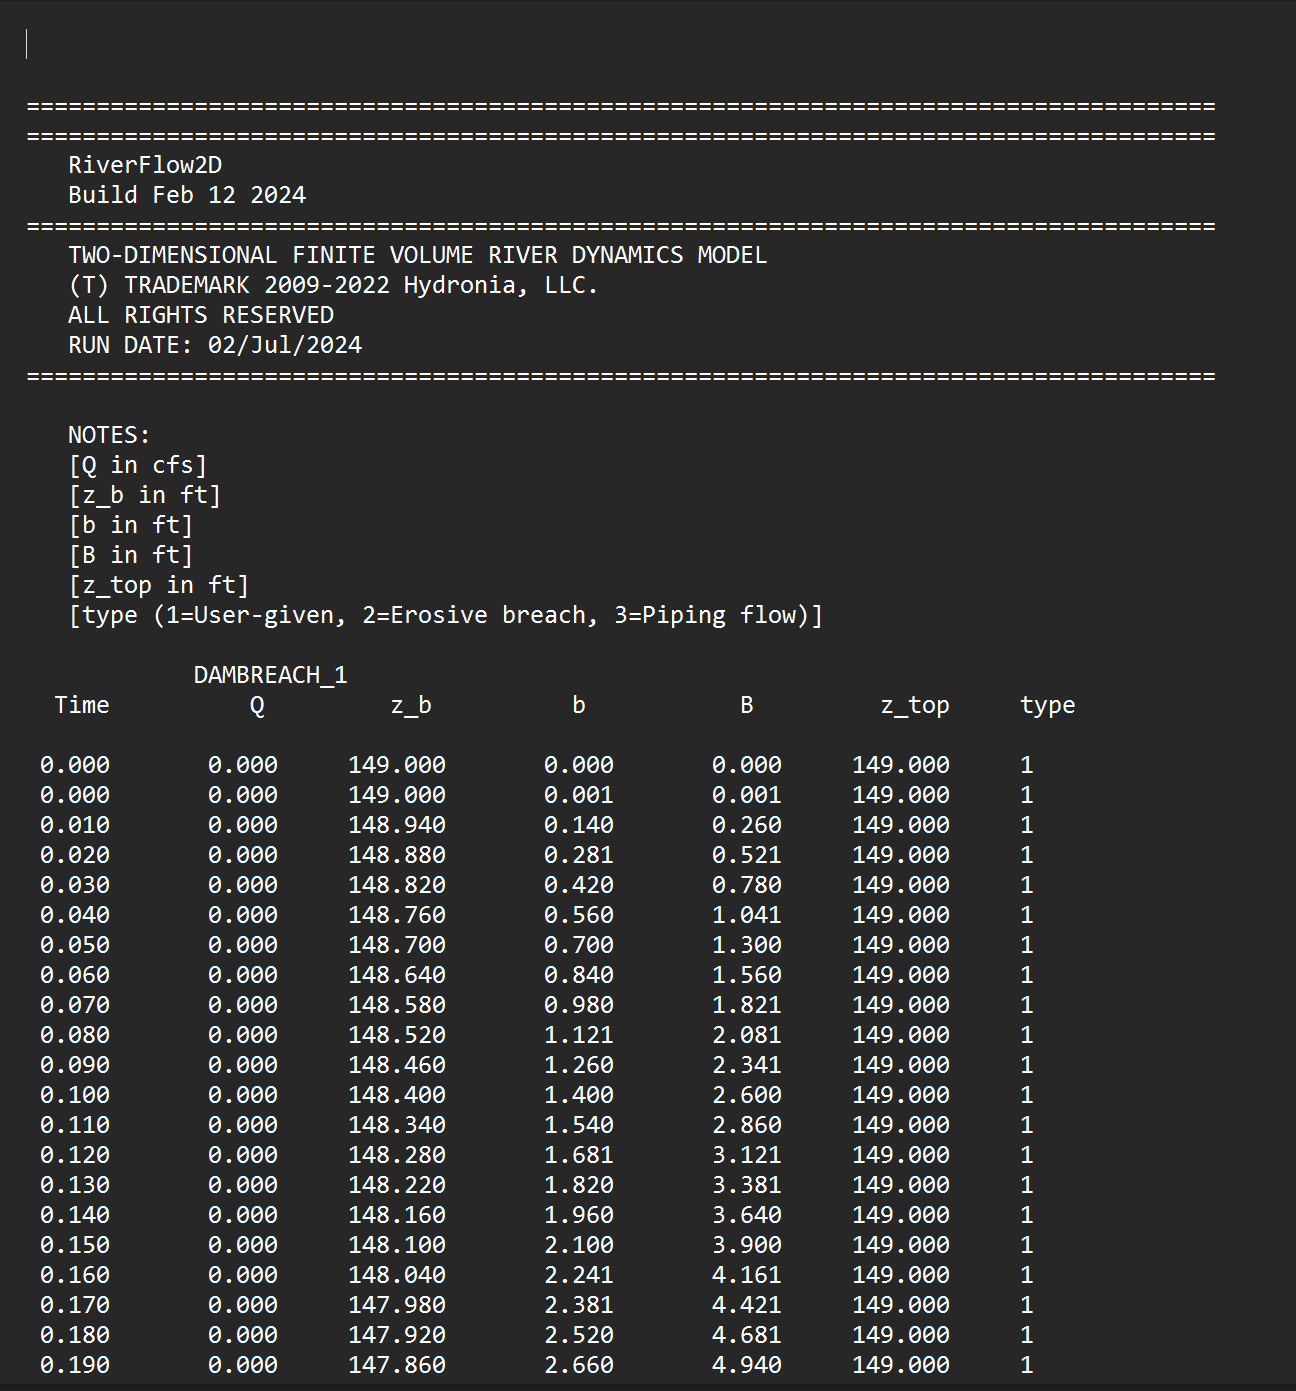
RiverFlow2D output the dam breach hydrograph in a file with extension '.dambreachh'. Figure 7.13 shows a section of that file for this exercise.
This concludes the Simulating dam breaches tutorial.